
We analysed every comparison of goods and services carried out by the INPI in its opposition decisions, pair by pair. A meticulous, granular effort that also enables our AIs to operate with precision.
Here is what the data shows – and what it changes for your practice and your clients.
Finding #1: INPI opposition decisions are broadly consistent – with some notable exceptions
Good news: for the vast majority of the most frequently compared pairs of goods and services, the INPI decides with remarkable consistency, in both directions.
Consistency towards identity, first, particularly where one item is a general category encompassing the other: shirts, socks or underwear against clothing, sports shoes against footwear, are overwhelmingly found identical or, at the very least, similar.
Consistency towards dissimilarity, second and this is more counter-intuitive: fashion accessories compared with clothing are found dissimilar in roughly 85 to 90% of decisions. Handbags, wallets, jewellery, watches, cosmetics, perfumes: against clothing, the INPI overwhelmingly rejects similarity, despite closely related commercial worlds. The same applies to fabrics ↔ clothing (raw material does not equal finished product) and to the many pairs opposing entertainment to technical services (film rental, photography, video editing): almost systematically dissimilar.
Yet this consistency is not absolute, even among the most frequently analysed pairs. Accountancy ↔ business management splits almost evenly between dissimilar and similar, as does commercial administration ↔ accountancy. Computer file management ↔ office work leans towards similarity but with a significant share of contrary decisions, and entertainment ↔ rental of stage scenery oscillates around two-thirds / one-third. Even for the fashion pairs mentioned above, the trend is clear but never unanimous.
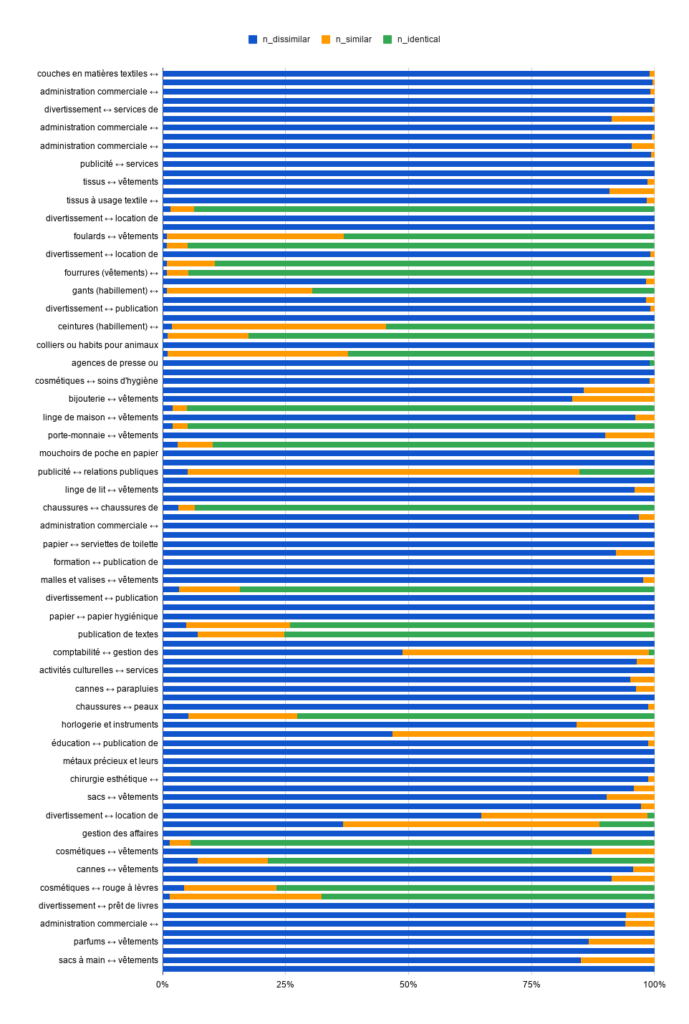
For practitioners with access to the decision history, the lesson is twofold: for a large share of comparisons, the outcome can be anticipated with a high level of confidence – including where it contradicts intuition, as with handbags / clothing. And the genuinely uncertain pairs can be identified in advance.
Finding #2: very real grey areas
For there is a second category of pairs, far less comfortable: those where decisions split almost evenly between similar and dissimilar. A few telling examples from the data:
- software ↔ computers, and their variants (software ↔ smartphones, e-readers ↔ software): ~50/50
- chocolate ↔ confectionery, jams ↔ honey, cakes ↔ bread, eggs ↔ dairy products: the same split
- footwear ↔ sports bags, jewellery ↔ works of art of precious metal, prospectuses ↔ advertising, business management ↔ commercial intermediation services: the same uncertainty
Stepping back, these grey areas fall into a few families:
- Software versus hardware: software compared with computers, smartphones, e-readers or smartwatches. The question of complementarity between software and hardware splits decisions down the middle – a direct issue for every tech filer.
- The food universe: chocolate and confectionery, jams and honey, cakes and bread, non-alcoholic aperitifs and wines. Neighbouring products on the shelf, yet differing in nature or production method – and the INPI hesitates. The same wavering appears between food products and restaurant services (fresh vegetables, fresh fruit, temporary accommodation versus catering).
- Intellectual services with porous boundaries: business management vs commercial intermediation, market research vs business management, prospectuses vs advertising. Activities that are close in economic reality, whose legal characterisation remains unsettled.
- And one extreme case: non-metallic building materials ↔ stained-glass windows, split between dissimilar and identical – two radically opposite outcomes for the same pair.
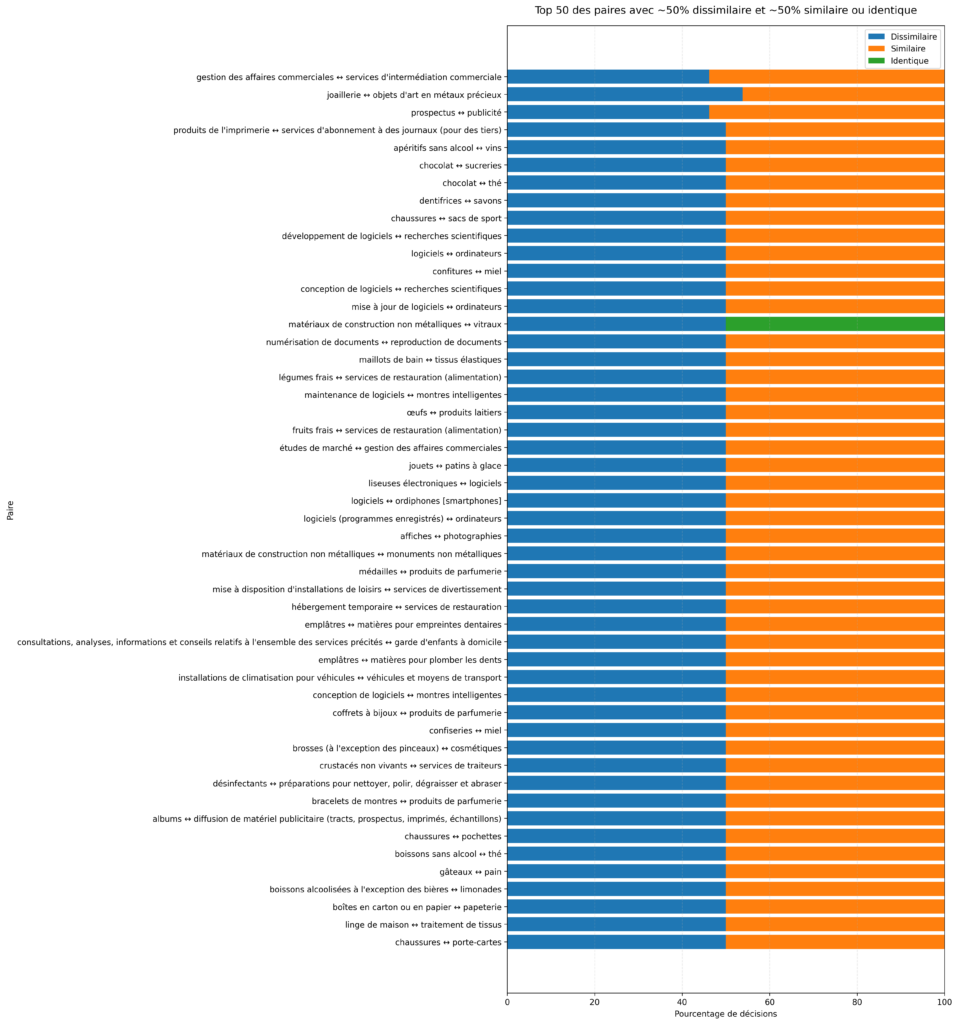
For these pairs, the outcome depends on the wording of the specifications, the arguments developed, the reasoning adopted, or simply the year of the opposition, as the INPI’s practice evolves. These are precisely the grey areas to assess before filing, opposing, or responding to an opposition.
Finding #3: the Nice Classification doesn’t tell the whole story
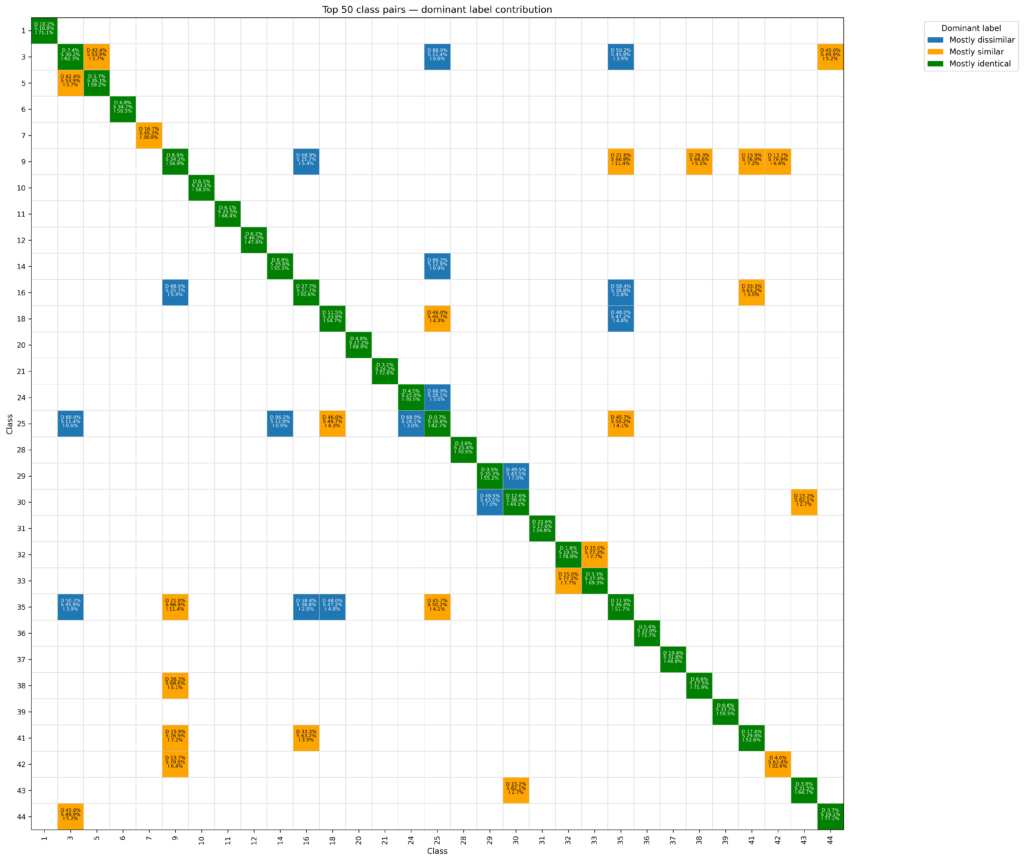
The third lesson confirms what practitioners know from experience: the matrix crossing Nice classes shows that class boundaries do not map onto similarity boundaries.
Unsurprisingly, comparisons within the same class overwhelmingly result in identity. But as soon as items from different classes are crossed, interesting patterns emerge:
- Items from different classes can be found predominantly similar: class 9 with classes 35, 38, 41 and 42 (the tech and digital content ecosystem), class 30 with class 43 (food and catering), or classes 32 and 33 (alcoholic and non-alcoholic beverages).
- Conversely, some frequent crossings lean clearly towards dissimilarity: classes 3, 14 and 25 (cosmetics, jewellery and clothing), for instance.
In other words: goods in different classes may be found similar, while goods in neighbouring classes may not be. And above all, these assessments can now be anticipated statistically.
This is what lipstip offers with DECIDE.
It follows that a clearance search or a watch based solely on identical class numbers misses the decisional reality — and therefore the actual risks.
What this changes in practice
This data transforms three key moments in trademark work:
- Before filing: identify whether the intended specifications fall into a grey area, and adjust the wording or coverage accordingly.
- Before opposing: objectively assess the chances of success on the comparison of goods and services, pair by pair, rather than by intuition.
- When responding to an opposition: rely on prior decisions in which the INPI found similarity or dissimilarity to build the argument.
This is exactly what lipstip enables: searching in seconds, across all opposition decisions, how a pair of goods and services has been assessed — with the source decisions to back it up.
Where a manual search would take hours, you get a statistical overview and the relevant precedents, ready to cite, in seconds.
Methodology: analysis of the comparisons of goods and services drawn from opposition and invalidity decisions published by the INPI, aggregated by pair of items and by Nice class.